
Data sources
Takeaways
This brief provides an overview of secondary data sources to assess food access, food environments, and diet-related health needs commonly used in community health needs assessments (CHNAs), along with some less frequently utilized sources that may complement widely used measures.
The brief also discusses recommendations for collecting primary data on food-related health issues in low-income communities in order to better understand facilitators and obstacles to healthy eating and to develop targeted and effective implementation strategies.
Together with the guidance brief on including food-related community organizations in the CHNA process these resources and recommendations can help you assess food access and food environment needs in your community.
This guidance brief provides an overview of secondary data sources (data collected by another organization) that may be useful in assessing food access, food environments, and diet-related health needs in your community. The brief concludes with some recommendations for collecting primary data (original data such as surveys, interviews, focus groups and environmental assessments) on food-related health needs in low-income communities. Primary data on underserved populations are vital for prioritizing health needs and informing intervention strategies.
Because collecting and analyzing data requires significant time and financial resources, hospitals and health systems are increasingly finding that collaborating with public health departments, schools of public health, community health and development organizations, food policy councils, food system advocacy groups, and other organizations is an effective way to maximize assessment resources and rally the community around a set of shared opportunities to improve community well-being and promote healthy, equitable, and sustainable food systems. Additionally, there are a wide variety of CHNA consultants that assist facilities and community collaboratives with conducting community health assessments and developing health improvement strategies.
Secondary data sources
Secondary data (data collected by other organizations) can be very valuable in assessing food access, food environments, and diet-related health needs in your community.
Food insecurity (economic indicators)
Data sources assessing food insecurity deal primarily with the financial factors impacting food access. This includes measures of income and poverty, including eligibility for government assistance programs such as SNAP (Supplemental Nutrition Assistance Program), WIC (Women, Infants, and Children Food Nutrition Services), and TANF (Temporary Assistance for Needy Families) and eligibility for free and reduced-price school meals. Food insecurity assessments may also evaluate food prices.
Low and very low food security (USDA)
The U.S. Department of Agriculture (USDA) identifies two levels of food insecurity. Low food security is identified when individuals report reduced quality, variety, or desirability of diet, but with little or no indication of reduced food intake. Very low food security is identified when multiple indications of disrupted eating patterns and reduced food intake are reported.
What it measures
The USDA collects survey data on the number of households with low or very low food security using a questionnaire administered as a supplement to the Census Bureau’s monthly Current Population Survey (CPS).
Where to access
- The USDA food insecurity data is available at the state level through annual reports. The most recent report from 2017 reflects 2016 data through ERS.
- Map the Meal Gap tool (searchable by state, county, food bank service area or congressional district).
- USDA Food Environment Atlas (searchable by state and county; available under “State Food Insecurity” tab)
- Community Commons’ Food Environment Reports (searchable by state and county, available under “Food Security” data category)
Data availability
Response data from questions attached to the Current Population Survey.
State
Data is three years old on average for these survey responses (most recently 2013-15)
Map the Meal Gap (Feeding America)
Feeding America’s Map the Meal Gap is one of the most widely used and easy to access sources of community-level data on food insecurity. The Map the Meal Gap index estimates county-level food insecurity by income categories and also estimates the food budget shortfall reported by food insecure individuals, which can illuminate the severity of food insecurity in a community.
What it measures
The Map the Meal Gap index estimates the percentage of households experiencing food insecurity using two kinds of data: county-level food insecurity data (from the Census Bureau and Department of Health and Human Services) and food budget shortfall data from the U.S. Department of Agriculture.
Where to access
Map the Meal Gap tool (searchable by state, county, food bank service area or congressional district).
Data availabiility
- Federal Poverty Rate. The percentage of households, adults, and children currently living below the Federal Poverty Level (Department of Health and Human Services).
- Homeownership (Census Bureau). The percentage of American adults who own a house (from Census Bureau’s Current Population and Housing Vacancy Surveys).
- Food Price/ Cost of Meal Indices (USDA). The USDA collects monthly indices of prices for consumer food products (e.g. poultry, milk, and fruit) and for those of producers (e.g. wholesale wheat, cattle, and vegetables). It also tallies the average national cost of a meal for food secure individuals using data on food consumption from the Census Bureau’s Current Population Survey.
- Average food budget shortfall for food insecure households (Calculated by Feeding America using USDA cost-of-food data). Captures the gap between what food insecure households can actually afford to spend on food each week and what the USDA’s food plans say they should be spending for adequate nutrition.
State, county, and congressional district
Data from 2015 (collected each year, published two years after collection)
Community food needs assessments

Arvada, Colorado and Sonoma County, California are two recent examples of communities coming together to create community food needs assessments (CFNAs). These assessments identify weaknesses as well as assets in the local food environment and outline potential interventions to promote a healthier, more equitable, and more sustainable food system. Common components of these assessments include a review of the community’s existing healthy food choices, fast food consumption, and barriers to consuming fresh and nutritious food. Often, these resources are developed by a coalition of organizations (such as public health departments, hospitals, and food advocacy groups) interested in understanding food needs like the Sonoma County Food System Alliance. The alliance identified challenges in meeting goals, including increasing local food production and the wages of local food system workers, and provided a roadmap for the community to follow to promote effective policy, system, and environmental changes. In Arvada, the city got creative with solutions to ease the difficulties of community members in particular neighborhoods in accessing affordable healthy food; the report concludes with recommendations for more spending on healthy school lunches, the creation of a mobile market to serve communities with inadequate access to fresh, healthy foods, and the planting of community vegetable gardens on vacant city land.
Percentage of households receiving WIC/SNAP (USDA Food and Nutrition Service)
Because the U.S. Department of Agriculture notes how many Americans are actually receiving these benefits (as opposed to how many are merely eligible for them), enrollment numbers for these programs provide a useful way of assessing the demonstrated need for food assistance. Note that the data is only available at the state level.
What it measures
Estimates the percentage of households who receive WIC (supplemental government nutrition benefits for low-income women, infants, and children) and SNAP (supplemental nutrition assistance for the general low-income population) benefits. Both programs are administered by the USDA’s Food and Nutrition Service (FNS).
Where to access
- FNS: WIC and SNAP data (Excel sheet format)
- USDA: Food Environment Atlas (searchable by state and county; available under “Food Assistance” tab)
- Community Commons’ Food Environment Reports (searchable by state and county; available under “Food Security” data category)
Data availability
USDA FNS collects its own data on program participation
State
Collected annually
Percentage of students eligible for free/reduced-price lunch (National Center for Education Statistics)
The percentage of students eligible for free or reduced-price school meals provides a proxy measure for the concentration of low-income students within a school. This indicator divides public schools into categories (high-poverty, mid-high poverty, and low-poverty) on the basis of the percentage of students eligible for free or reduced-price lunch; high-poverty schools are those where more than 75 percent of the students are eligible for free or reduced-price lunch. This is a useful indicator of vulnerability to food insecurity at the local level.
What it measures
Records the percentage of the total population participating in United States Department of Agriculture (USDA) Food and Nutrition Service (FNS) child nutrition programs, as well as the total number of meals served in those programs.
Where to access
- USDA FNS: Child Nutrition Tables (to see number of meals served)
- USDA Food Environment Atlas ( to see percentage of population participating; available under “Food Assistance” tab)
Data availability
- Population data: U.S Census Bureau’s population estimates
- Program participation data: USDA FNS: Child Nutrition Tables
State
- Population estimates are made annually from census data collected every ten years.
- Data on the percentage of population participating was collected in 2009 and 2015.
- Data on number of meals served in each program is collected annually.
Percentage of population participating/number of meals served in National School Lunch, School Breakfast, and Summer Feeding programs
Statistics on participation in government school feeding programs provide a useful picture of both child poverty (since eligibility for these programs is determined by income levels) and the food insecurity with which it is closely linked.
What it measures
Determines the percentage of students eligible for free or reduced-priced lunch in elementary, middle, and high schools based on income thresholds set by the Department of Education’s National School Lunch Program.
Where to access
- National School Lunch Program data - National Center for Education Statistics (NCES) Elementary/Secondary Information System (searchable by state, county, private/public, and school district; )
- USDA: Food Environment Atlas (searchable by state and county)
- Community Commons’ Food Environment Reports (searchable by state and county; available under “Food Security” data category)
Data availability
Public Elementary/Secondary School Universe Survey (NCES)- provides data on student demographics and National School Lunch Program eligibility.
State, school district, and school
Collected annually, most recent published data from 2014-15
Federal poverty level (U.S Census Bureau)
The federal poverty level has a strong correlation with food insecurity, and the poverty level as estimated by the American Community Survey is a common component of measures of food insecurity.
What it measures
The federal poverty level has a strong correlation with food insecurity, and the poverty level as estimated by the American Community Survey is a common component of measures of food insecurity.
Where to access
- Small Area Income/Poverty estimates map: (searchable by state and county)
- U. S. Department of Agriculture (USDA): Food Environment Atlas (searchable by state and county; available under “Socioeconomic Characteristics” tab)
- Community Commons’ Food Environment Reports (searchable by state and county; available under “Demographics” data category)
Data availability
- American Community Survey (U.S Census Bureau) - The Census Bureau’s annual survey of the country’s demographic and household characteristics,
- Small Area Income/Poverty Estimates (U.S Census Bureau) - Produces annual estimates of household income by school district, as well as the proportion of adults and children living in poverty by school district.
- USDA: State and county
- Feeding America/Nielson: State and county
- USDA’s Economic Research Services’ Food Price Outlook presents three-year average consumer food price data, updated annually
- Nielsen shares food price data with Feeding America; data updates usually lag two years and are not publicly available
Food price indices (USDA Economic Research Service and Feeding America)
A food price index reveals differences in food costs at the county level and indicates regions where greater income may be needed to meet food needs. Food price data can be combined with income data to estimate food budget shortfalls.
What it measures
- The U.S. Department of Agriculture’s Food Environment Atlas includes an index of the prices of low-fat milk and soda relative to the national average price.
- Feeding America/Nielsen’s cost-of-food index is taken from the prices of a basket of 26 foods and is incorporated in Feeding America’s food security measure.
Where to access
- USDA: Food Environment Atlas (searchable by state and county; available under “Food Prices and Taxes” tab)
- Feeding America: Map the Meal Gap
Data availability
- Cost of low-fat milk and soda (USDA Economic Research Service)
- Cost of basket of 26 foods (Feeding America/Nielsen)
- USDA: State and county
- Feeding America/Nielson: State and county
- USDA’s Economic Research Services’ Food Price Outlook presents three-year average consumer food price data, updated annually
- Nielsen shares food price data with Feeding America; data updates usually lag two years and are not publicly available
Assessing the food environment
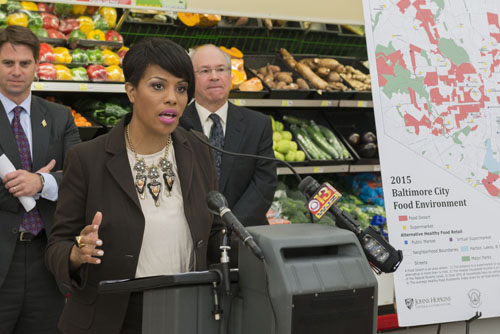
Food environment assessments (FEAs) are studies focusing on the current status of a community’s food system. These assessments are helpful for community leaders seeking to understand how their food environment is impacting residents, before taking steps to improve upon it. Mapping and classifying different types of food outlets, identifying local food producers, and proposing solutions to better connect the two are frequently included topics in FEAs. As is often the case, FEAs conducted in Baltimore and Blaine County, Idaho were developed by coalitions of organizations (like public health departments, hospitals, and food advocacy groups) interested in understanding their community’s food environment. In 2015, the Johns Hopkins Center for a Liveable Future and the City of Baltimore mapped the city’s food outlets, assessed the availability of healthy food, and surveyed residents’ perception of their food options. The report’s authors also piloted three policy interventions aimed at providing healthier options in locally owned corner stores and carryout restaurants. The assessment is a robust resource for local hospitals to draw from in their community health needs assessments and implementation strategy planning. Meanwhile, Blaine County’s Hunger Coalition researched the ability of food producers and consumers to bolster local, healthy food production and reduce food waste.
Percent additional tax on soda or packaged snacks (The University of Illinois-Chicago’s Bridging the Gap Program)
Data on whether or not a given state places additional taxes on unhealthy food and beverages like chips and soda can be a good illustration of that state’s overall food environment. If these products are more expensive as a result of tax, they may be less frequently consumed by residents of the state in question.
What it measures
Examines existing state taxes on soda and chips/pretzels sold in food stores and vending machines. Determines whether or not the sales tax on soda or packaged snacks is higher than the general sales tax on food items. Also records if there are non-sales taxes at the manufacturing, transportation, or retail stages of these products’ life cycles.
Where to access
- The University of Illinois-Chicago’s Bridging the Gap Program: Soda/Snack Taxes
- United States Department of Agriculture (USDA) Food Environment Atlas (searchable by state and county; available under “Food Prices and Taxes” tab)
Data availibility
Compiled by the MayaTech Corporation on behalf of Bridging the Gap, data was collected by examining existing state statutory and regulatory laws, and then verifying each state’s laws by telephone with a tax official.
State
Data collected in 2014
Food access (geographic indicators)
Data sources that measure food access are those that assess the physical environment in which residents make their food choices. These consist of measures of the distance a consumer needs to travel to reach food outlets. Another subset of measures in this category assesses the density of various types of food outlets for a given number of residents.
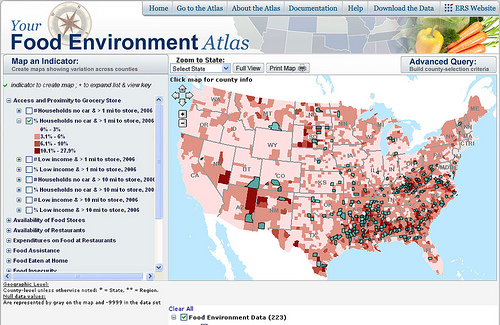
Percentage or number of households with “low food access” (USDA)
The U.S. Department of Agriculture’s Food Environment Atlas provides a useful way of visualizing the varying degrees of geographic isolation from food sources. It is a useful complement to the sources above, which place more emphasis on financial constraints to food access.
What it measures
- The percentage of the population meeting 4 categories of “Low Food Access” according to the USDA.
- More than 1 mile (urban) or 10 miles (rural) from a supermarket
- More than ½ mile (urban) or 10 miles (rural) from a supermarket
- More than 1 mile (urban) or 20 miles (rural) from a supermarket
- Low access to a vehicle or more than 20 miles from a supermarket
Where to access
- USDA Food Environment Atlas (searchable by state and county; available under “Access and Proximity to Grocery Stores” tab)
- USDA Food Access Research Atlas (searchable by state and county; available under “Component Layers 2015” tab) Note: This tool does not function properly within the Google Chrome web browser.
Data availability
- Population data: Census Bureau’s population estimates
- Store data: USDA Supplemental Nutrition Assistance program (SNAP) Retailer Directory and Nielsen Trade Dimension’s TDLinx Directory of Stores (neither are publicly available).
State and county
Data are collected every census year (every ten years), estimates made annually, and these estimates are averaged every three (for example, data was collected in 2010. Estimates of changes in the data were made every year after 2010, and these yearly estimates are averaged every three years for a more reliable estimate.)
Grocery store density (USDA)
This data can be usefully combined with the distance-focused “low food access” measure to provide additional information on food outlet access in different communities. Note that the most recent data is from 2012.
What it measures
The U.S. Department of Agriculture measures the number of grocery stores per 1,000 residents (see: “Indicator: Grocery stores/ 1,000 pop”)
Where to access
- USDA Food Environment Atlas (searchable by state and county; available under “Store Availability” tab)
- Community Commons: Food Environment Reports (searchable by state and county; available under “Food Security” data category)
Data availability
- Data on the number of grocery stores are taken from the Census Bureau’s County Business Patterns.
- The population data component comes from the Census Bureau’s Population Estimates Program.
State and county
Data collected in 2007, 2012
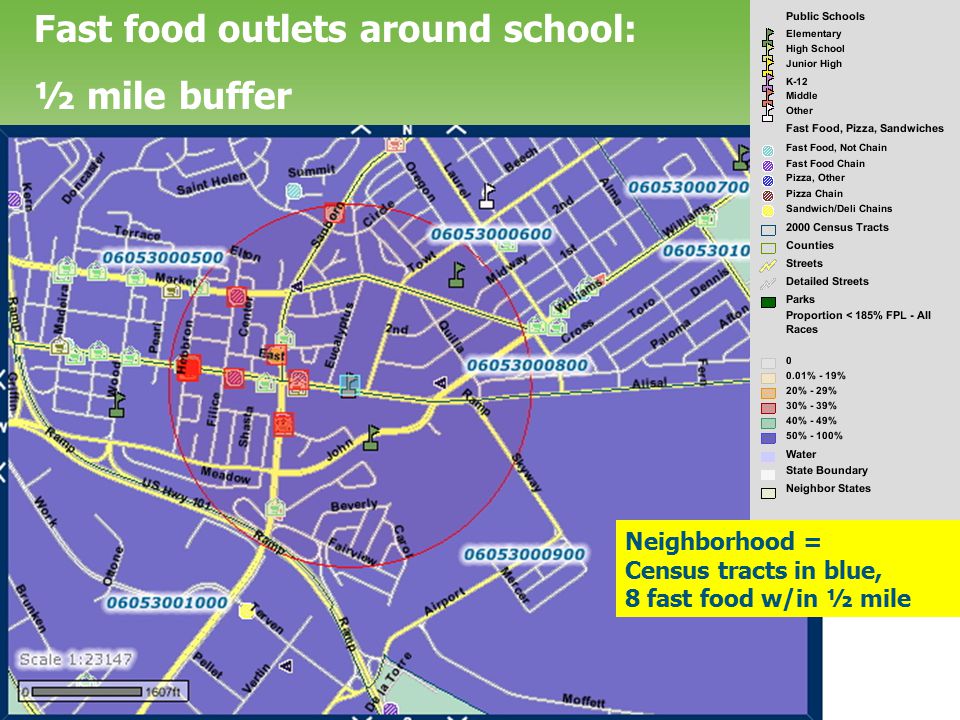
Fast food restaurant density (USDA)
The U.S. Department of Agriculture uses this data to assess the availability of unhealthy food in a given community, which contributes to unhealthy dietary patterns and risk of diet-related health conditions. Note that the most recent data is from 2012.
What it measures
The USDA measures the number of fast food restaurants per 1,000 residents ( see: “Indicator: Fast-food restaurants/1,000 pop”)
Where to access
- USDA Food Environment Atlas (searchable by state and county; available under “Restaurant Availability and Expenditures” tab)
- Community Commons: Food Environment Reports (searchable by state and county; available under “Food Security” data category)
Data availability
- Data on the number of fast-food restaurants is taken from the Census Bureau’s County Business Patterns.
- The population data component comes from the Census Bureau’s Population Estimates Program.
State and county
Data collected in 2007, 2012
Number of convenience, supercenter, and specialized food stores (Census Bureau’s County Business Patterns)
Knowing the number of any given category of food store in an area can provide a clear sense of the nutritional quality of the food available in that area. For example, convenience stores tend to sell a large variety of soda and chips, but little to no fresh produce. If an area has more convenience stores than conventional grocery stores, it can be a sign that there aren’t many nutritious food options available in that community.
What it measures
Records the number of stores per county in categories set by the North American Industry Classification System (NAICS).
Where to access
- U.S Census Bureau: Legal Form of Organization Tables
- U.S. Department of Agriculture (USDA): Food Environment Atlas (searchable by state and county; available under “Store Availability” tab)
Data availabaility
Collected by the Census Bureau from administrative records of each American establishment with paid employees.
State, county
Data collected in 2009 and 2014
Modified Retail Food Environment Index (mRFEI) (CDC’s Division of Nutrition, Physical Activity and Obesity)
This index compares the quality of the retail food offerings available at the census-tract level.
What it measures
Modified Retail Food Environment Index (mRFEI) compares the proportion of “healthy” food retailers to less healthy food retailers in an area based on the typical nutritional quality of the food sold in each type of retailer.
Where to access
- Centers for Disease Control (CDC): Census tract-level state maps of mRFEI
- CDC: mRFEI data table
Data availability
U.S Census Bureau County Business Patterns: Legal Form of Organization Tables(CDC used data on the number of food stores in each category to generate the data)
Census tract
mRFEI scores calculated in 2016; retailer data from 2009 and 2014
Environments Supporting Healthy Eating Index (African American Collaborative Obesity Research Network and Community Commons)
The Environments Supporting Healthy Eating (ESHE) Index boasts a unique combination of data in one score, particularly in its measure of state policies. The index is a way to compare county food environments among peers, within the context of a state’s relative strength or weakness in encouraging healthy eating.
What it measures
Scores the healthiness of a community’s food environment using a weighted mix of indicators.
Where to access
Community Commons: ESHE Index (searchable by state and county)
Data availabaility
- The University of Illinois-Chicago Bridging the Gap: Additional Sales Tax on Soda and/or Chips/Pretzels (2014, state level)
- National Center for Education Statistics (NCES)/Bridging the Gap: School Nutrition Environment Score (2012-13, state-level)
- The University of Colorado Denver, National Resource Center for Health and Safety in Child Care and Early Education: Child Care Nutrition Policy Score (2011, state-level)
- U.S. Department of Agriculture (USDA) Economic Research Service (ERS): Low-income population with low access to a grocery store (2015, county-level)
- USDA FNS/ Census Bureau: WIC-authorized stores per 1,000 low-income residents (population data from 2009-13, WIC data from 2012, both county-level)
- USDA FNS/ Census Bureau: SNAP-authorized stores per 1,000 low-income residents (population data from 2009-13, SNAP data from 2016, both county-level)
- USDA Agricultural Marketing Service/ Census Bureau: percentage of population with access to a farmers market (farmers market data from 2016, population data from 2010, both county-level)
- USDA Agricultural Marketing Service/Census Bureau: percentage of low-income population with access to a farmers market (farmers market data from 2016, population data from 2010, both county-level)
- Centers for Disease Control and Prevention (CDC): modified Retail Food Environment Index (mRFEI) (2011, census tract-level)
State and county
Published annually, but component data vary widely in date of collection.
SNAP/WIC authorized retailer density (USDA)
Authorized retailers who offer the Supplemental Nutrition Assistance Program (SNAP) and Women, Infants, and Children Food and Nutrition Services (WIC) must meet the U.S. Department of Agriculture’s (USDA) nutritional standards for healthy food inventory.This measure provides a reliable way to capture additional outlets that sell healthy food options, such as corner stores and farmers markets. Note that the most recent data is from 2012.
What it measures
Density of retailers authorized to accept SNAP/WIC benefits (see “Indicator: SNAP-authorized stores/ 1,000 pop.” and “Indicator: WIC-authorized stores/ 1,000 pop.”)
Where to access
- USDA Food Environment Atlas (searchable by state and county; available under “Store Availability” tab)
- Community Commons: Food Environment Reports (searchable by state and county; available under “Food Insecurity” data category)
Data availabaility
- SNAP retailer data comes from the USDA's Food and Nutrition Service, SNAP/WIC Benefits Redemption Divisions.
- The population data component comes from the Census Bureau’s Population Estimates Program.
State and county
Data collected in 2008, 2012
Local food directories (USDA Agricultural Marketing Service)
The U.S. Department of Agriculture’s (USDA) Agricultural Marketing Services Farmers Market Directory is a searchable tool that provides information about healthy, local food sources in your community. Assessing the availability of farmers markets and other outlets for purchasing local, healthy food is a valuable component of understanding community food environments.
What it measures
Provides geographically searchable directories of food hubs, community supported agriculture programs (CSAs), on-farm markets, and farmers markets.
Where to access
Data availability
Listing of registered food hubs, CSAs, on-farm markets, and farmers markets by area.
Searchable by zip code
2016
Number of farms with direct sales (USDA)
The U.S. Department of Agriculture’s Agricultural Marketing Services directory of farms that sell directly to consumers is a searchable tool that provides information about healthy, local food sources available in communities across the country.
What it measures
Provides information on the number of farms in a given area which sell products directly to consumers.
Where to access
- USDA Census of Agriculture: Direct to Consumer Sales
- USDA Food Environment Atlas (searchable by state and county; available under “Local Foods” tab)
Data availabaility
USDA Census of Agriculture: Local Food Marketing Practices Survey
County
Data from 2015
Combined economic and geographic indicators
Some assessments of communities with inadequate access to healthy food options combine measurements of low economic access with low geographic access.
Food Environment Index (County Health Rankings & Roadmaps)
County Health Rankings’ Food Environment Index is useful as a simple metric for comparison of healthy food access among counties. It is most useful for making initial comparisons between similar areas’ food environments before delving deeper with other tools.
What it measures
Generates a score for the quality of an area’s food environment of 0 (worst) to 10 (best) by equally weighing two components: the percentage of the population that is low income and does not live close to a grocery store, and the percentage of the population that is food insecure.
Where to access
County Health Rankings’ Food Environment Index (searchable by state and county).
Data availability
- Limited access to healthy food uses USDA data to estimate the percentage of the population that is low-income and does not live close to a grocery store. Living close to a grocery store is defined differently in rural and urban. "Low income" is defined as having an annual family income of less than or equal to 200 percent of the federal poverty threshold for the family size.
- Estimate of the percentage of a county’s population that was food insecure/did not have access to a reliable source of food at any point in the past year (using a model drawing on data from.the Community Population Survey, Bureau of Labor Statistics, and American Community Survey).
State and county
Data from 2010 and 2014
Food Access Research Atlas (USDA)
This tool provides local areas (census tracts) that are both low-income and low-access.
Note: tool does not work properly in Google Chrome browser, but functions smoothly in all other browsers.
What it measures
Identifies census tracts which are both low-income (20 percent or more of residents are impoverished) and low-access (see U.S. Department of Agriculture “Low Food Access” measure above).
Where to access
USDA Food Access Research Atlas: (searchable by state, county, and census tract)
Data availability
- Income data: Based on census tract-level estimates taken from American Community Survey data from 2010-14.
- Population data: 2010 U.S Census (you can zoom in on census tracts in the searchable map).
- Grocery Store Data: Created by combining the USDA’s 2015 STARS (Store Tracking and Redemption System) directory of authorized SNAP retailers and Nielsen’s 2015 Trade Dimensions TDLinx directory of grocery stores. Neither source is publicly available.
State, county, and census tract
Data from 2010-14 (income), 2010 (population), and 2015 (grocery store data).
Communities of Excellence in Nutrition, Physical Activity, and Obesity Prevention (California Department of Public Health)
The unique strength of Communities of Excellence in Nutrition, Physical Activity, and Obesity Prevention (known as CX3) is its ability to display accurate and recently collected data at the level of individual neighborhoods, without having to rely on estimates for smaller areas based on data collected at the national level. While the tool only covers California as of 2017, CDPH’s Nutrition Education and Obesity Prevention Branch is willing to share their data collection tools with agencies and organizations affiliated with it “via project grants, awards, and partnerships” and can support evaluators outside of California to make use of the tool.
What it measures
Searchable map of California’s food environment assets (e.g. after-school snack programs and Catholic Charities offices) and liabilities (e.g. fast food restaurants and convenience stores), with optional layers for demographics and government food program participation rates.
Where to access
California Department of Public Health: CX3 Tool
Data availability
(Searchable layers for the following data categories contain data from numerous sources)
- “Health, Nutrition, and Education” includes organizations and institutions which have a positive effect on a community’s food environment through
- the provision or promotion of health care
- the provision or promotion of nutritious eating or
- education on healthy eating and obesity prevention. Examples include local health departments, university agricultural cooperative extension sites, CalFresh (California’s version of the SNAP program) office locations, and colleges.
- “Retail Food Channels” are any type of business which sells food. Examples include CalFresh-certified vendors, general grocery stores, fruit/vegetable markets, and fast food/pizza/sandwich restaurants. This category also allows the user to view census tracts without healthy retail options.
- “Current Eligibility Layers” consists of map layers showing the percentage of the population eligible to participate in government feeding programs. As of 2017, the only measure in this category was that of schools and school districts where 50 percent of students are eligible for free/reduced-price school meals.
- “Demographics” contain straightforward layers of income groups and racial/ethnic populations. Examples include the percentage of households with income below $20,000, the percentage of non-Hispanic whites with incomes below 100 percent of the Federal Poverty Level, and the percentage of Native Americans with incomes below 100 percent of the Federal Poverty Level.
State, county, and census tract
Data from 2016
Food behaviors (behavioral health indicators)
The most widely available data sources on food-related behavioral health indicators are those with information on the purchase or consumption of fruits and vegetables, sugar-sweetened beverages, and high-sodium foods; the frequency of family meals; and consumption of fast-food restaurant meals.
National food consumption data from CDC’s Behavioral Risk Factor Surveillance Survey (BRFSS)
As a group, these food behavior indicators provide information about the decisions eaters are making in the context of their food environments. While this data can be a valuable component of community health needs assessments (CHNA), the Centers for Disease Control and Prevention’s BRFSS survey 5-year averages for food behaviors aren’t up to date as of 2017 due to changes in collection practices between 2009 and 2011 (namely greater weighting of cell phone responses and new questions on fruit and vegetable consumption). Data has not been made available for the county level since then.
What it measures
The number of servings of fruits and vegetables, sugar-sweetened beverages, and high-sodium foods consumed by Americans over a given timespan (see “Section 12: Fruits and Vegetables”, “Module 14: Sugar Sweetened Beverages”, and “ Module 15: Sodium or Salt-related Behavior”)
Where to access
- BRFSS Prevalence and Trend Data (searchable by topic e.g. fruit consumption) and state)
- Community Commons: Food Environment Reports (searchable by state and county; available under “Dietary Behaviors” data category)
Data availability
A national telephone survey of health behaviors, BRFSS’ yearly goal is to complete 4,000 interviews in each state, but the number can be higher if individual states want estimates for various subpopulations within their borders. States decide which optional modules they will attach to the core questions each year. In 2016, for example, no states used the sodium-related module and seven (Delaware, Indiana, Mississippi, New Jersey, Ohio, Texas, and West Virginia) used the sugar-related module.
State (data not available on county level since 2011)
Core question data are collected annually, with some modules added at the discretion of individual states each year (no modules are collected annually by all states).
Family meal frequency (CDC National Survey of Children’s Health)
Eating meals together as a family is a healthy food behavior. This data source from the Centers for Disease Control and Prevention (CDC) can provide useful reference information, but it is available at the state level only.
What it measures
Measures the number of days in a week that a respondent child eats a meal with his or her family.
Where to access
- CDC: National Survey of Children’s Health
- Community Commons: Food Environment Reports (searchable by state and county; available under “Family Behaviors” data category)
Data availability
State
Data from 2016, updated annually.
Fast food/full-service restaurant expenditures per capita (Census Bureau)
Eating meals in fast food restaurants is on average considered a less healthy food behavior. This data source can provide useful reference information, but it is available at the state level only.
What it measures
Captures the amount of money spent per capita on meals from two different categories of restaurants identified by the Census Bureau.
Where to access
- Census Bureau: Accommodation and Food Services: Geographic Area Surveys
- U.S. Department of Food and Agriculture: Food Environment Atlas (searchable by state and county; available under “Restaurant Availability and Expenditures” tab)
Data availability
- Expenditure Data: Census Bureau, geographic area survey
- Population Data: Census Bureau, population estimates
State
Data from 2012
Composite reports
These searchable databases enable users to generate reports that capture multiple dimensions of food environments and eating behaviors, together with diet-related health outcomes, in their communities.
Food Environment Reports (Community Commons)
Community Commons’ Food Environment Reports is useful for gaining a comprehensive understanding of a community’s food environment. Using a wide variety of sources, the tool provides reliable data through a user-friendly, searchable interface.
What it measures
Produces county-level data graphics from indicators measuring eating habits, food infrastructure, and health outcomes.
Where to access
Community Commons’ Food Environment Report (searchable by state and county)
Data availability
- Demographics: population, race/ethnicity, and income (Census Bureau’s American Community Survey).
- Location of healthy food outlets: farmers markets, community supported agriculture (CSA) programs, and food hubs (U.S. Department of Agriculture Agricultural Marketing Service’s Local Food Directories).
- Rates of diet-related disease: such as diabetes, heart disease, and obesity (Centers for Disease Control and Prevention’s Behavioral Risk Factor Surveillance System)
- Consumption of different types of sugary drinks (soda vs. fruit-flavored) (CDC BRFSS)
- Consumption of different types vegetables (green, orange, and beans) (2015 CDC BRFSS)
- Rate at which families eat meals together ( CDC’s National Survey of Children's Health)
State
Reports generated from a wide variety of data collected in different years.
Food Environment Atlas (USDA)
The Food Environment Atlas is an indispensable catch-all directory of U.S. Department of Agriculture food environment data. The easy-to-use map presentation makes data simple to compare between states and counties.
What it measures
Searchable set of maps of the United States food environment viewed through multiple lenses of analysis.
Where to access
USDA: Food Environment Atlas
Data availability
- Access and Proximity to Grocery Stores: Population data from Census Bureau’s Population Estimates. Store data from USDA Supplemental Nutrition Assistance Program (SNAP) Retailer Directory and Trade Dimensions TDLinx Directory of Stores (not publicly available)
- Store Availability: US Census Bureau’s County Business Pattern
- Restaurant Availability and Expenditures: US Census Bureau’s County Business Patterns and Geographic Areas Survey
- Food Assistance: USDA Food and Nutrition Services Program Data
- State Food Insecurity: USDA/Census Bureau Current Population Survey - Food Insecurity Supplement
- Food Prices and Taxes: Food Price Data: Cost of milk and low-fat soda. Tax Data: The University of Illinois Chicago’s Bridging the Gap Program
- Local Foods: USDA AMS Local Food Directories and the USDA Census of Agriculture: Direct to Consumer Sales
- Health and Physical Activity: Health & Physical Activity Data: CDC BRFSS. Fitness Facilities Data: Census Bureau’s County Business Patterns
- Socioeconomic Characteristics: 2010 Census
State, county, and census tract (scale varies by map layer)
Atlas created in 2014, last updated in 2017
Primary data
Community health needs assessments (CHNAs) should evaluate not only secondary data sources but also collect and analyze primary data (original data such as surveys, interviews, focus groups and environmental assessments) about community health needs, especially in underserved communities (such as in low-income census tracts or neighborhoods identified as having greater needs and fewer resources).
Primary data are vital to help hospital leaders make difficult decisions about where to direct limited resources to address a community’s most pressing health challenges.
Key informant interviews, focus groups, and community surveys are all useful ways to identify food-related resources, challenges, and priorities in particular communities.
Thoroughly identifying community organizations and resources addressing food needs and food environments is an important step in the CHNA process. These organizations can provide critical insights, help develop interview questions and surveys, facilitate or participate in data collection, and assist with data analysis and needs prioritization.
![Participants of a Cooking Matters program learn about the benefits of label reading during a grocery store tour. [Share Our Strength]](/sites/default/files/inline-images/grocery%20store%20tour%20w.%20label%20reading%202007.jpg)
Key informant interviews
These interviews are valuable for gathering insights from key stakeholders and other community leaders.
For hospitals looking to understand food-related health needs in their CHNA process, key informant interviews with staff at food banks, soup kitchens, other organizations that work with low-income and underserved populations, and food advocacy organizations can provide critical insights into priority issues as well as opportunities and assets to address these needs in the community.
In Florida, Orlando Health Arnold Palmer Hospital for Children interviewed food bank staff, leaders of racial and ethnic minority communities, local business leaders, school officials, and advocates for the homeless as part of a CHNA process that investigated three interconnected community health challenges: obesity, poverty, and lack of access to healthy food. Arnold Palmer’s selection of a diverse group of key informants helped to identify the serious threat posed by diet-related disease and a lack of healthy food options to the community’s youth.
Focus groups
Focus groups can elicit vital experiences and insights from members of your community. The conversational atmosphere of these meetings makes people feel at ease expressing their beliefs and concerns.It is recommended that these not be held at the hospital but at a community location.
In California, Sutter Health Eden Medical Center conducted four targeted focus group meetings as part of its 2016 CHNA process, meeting with and hearing concerns from a group of Spanish-speaking residents, residents of two vulnerable “communities of concern,” and individuals recovering from battles with drug and alcohol addiction. The individuals who participated in these focus groups shared their personal experiences of living in largely unhealthy food environments, helping to inform implementation strategy programming from the hospital centered on healthy food provision.
Surveys
Surveys that ask community members about their health concerns are important tools for collecting data on pressing needs in the community. Surveys can include questions about food access, food behaviors, or diet-related health conditions as part of a more general survey, or can focus more narrowly on food environments and food needs. In order to collect responses from vulnerable population groups, it is useful to work with community organizations that work with these groups to administer surveys.
The USDA Economic Research Service provides a variety of standardized survey tools and other resources to assess food insecurity. Using these instruments will strengthen the validity and reliability of the resulting data and maximize comparability with national statistics.
In Oregon, Providence Hood River Memorial Hospital mailed a food survey to over a thousand households in its service region. In addition, surveys were hand-administered in targeted areas to ensure participation from non-English speaking, elderly, and/or low-income households.
Sample questions to include in interviews or focus groups
- Is it difficult for you to get the food you want/need? If so, how often is this a problem?
- In the past year, have you or any of your family members:
- worried about running out of food
- run out of food
- skipped entire meals
- gone without food so that children could eat
- experienced more than one of these obstacles to eating
- What makes it hard for you and your family to eat healthy meals?
- cost
- distance to store
- transportation
- time for shopping and food preparation
- shopping on a budget
- inexperience in preparing healthy meals
- language/cultural barriers
- taste preferences
- Would you be interested in participating if any of the following programs were created in your community?
- food preservation classes (canning, drying, freezing, etc.)
- cooking classes
- nutrition and healthy eating classes
- community land for gardening
- gardening classes
- Do you know of any farmers markets that sell fruits and vegetables on certain days, fairly close to where you live?
- How sure are you about where to get fresh fruits and vegetables in your neighborhood?
Learn more/additional resources
-
Public Health Institute’s Making Food Systems Part of Your Community Health Needs Assessment provides valuable guidance for assessing and addressing local food environments in community health assessments.
-
Researchers at the University of Pennsylvania have developed a series of validated Nutrition Environment Measure Surveys and tools to assess the healthfulness of food offerings, price, quality, and marketing in retail food outlets.